Oregon HS Tennis Power Rankings
The first power ranking for Oregon high school tennis teams. I designed the formula, built the entire site, and put it online on live statewide data. Teams across Oregon used it as a reference all through the 2026 season.
- Problem
- Win-loss records ignore who you played and count every flight the same, so a coach could stack a lineup to look better.
- System
- A statewide rating system built on four years of match data, with a playoff simulator and live tournament tools.
- Mechanics
- Four rating models. FWS weights the eight flights from 1.00 down to 0.10, so depth counts and stacking stops paying. The Power Index blends it with an RPI-style strength of schedule.
- Stack
- Python pipeline; React, TypeScript and Vite; static hosting on Netlify.
- Result
- Independent rankings, like the computer rankings in college football and basketball, run live through the 2026 season.
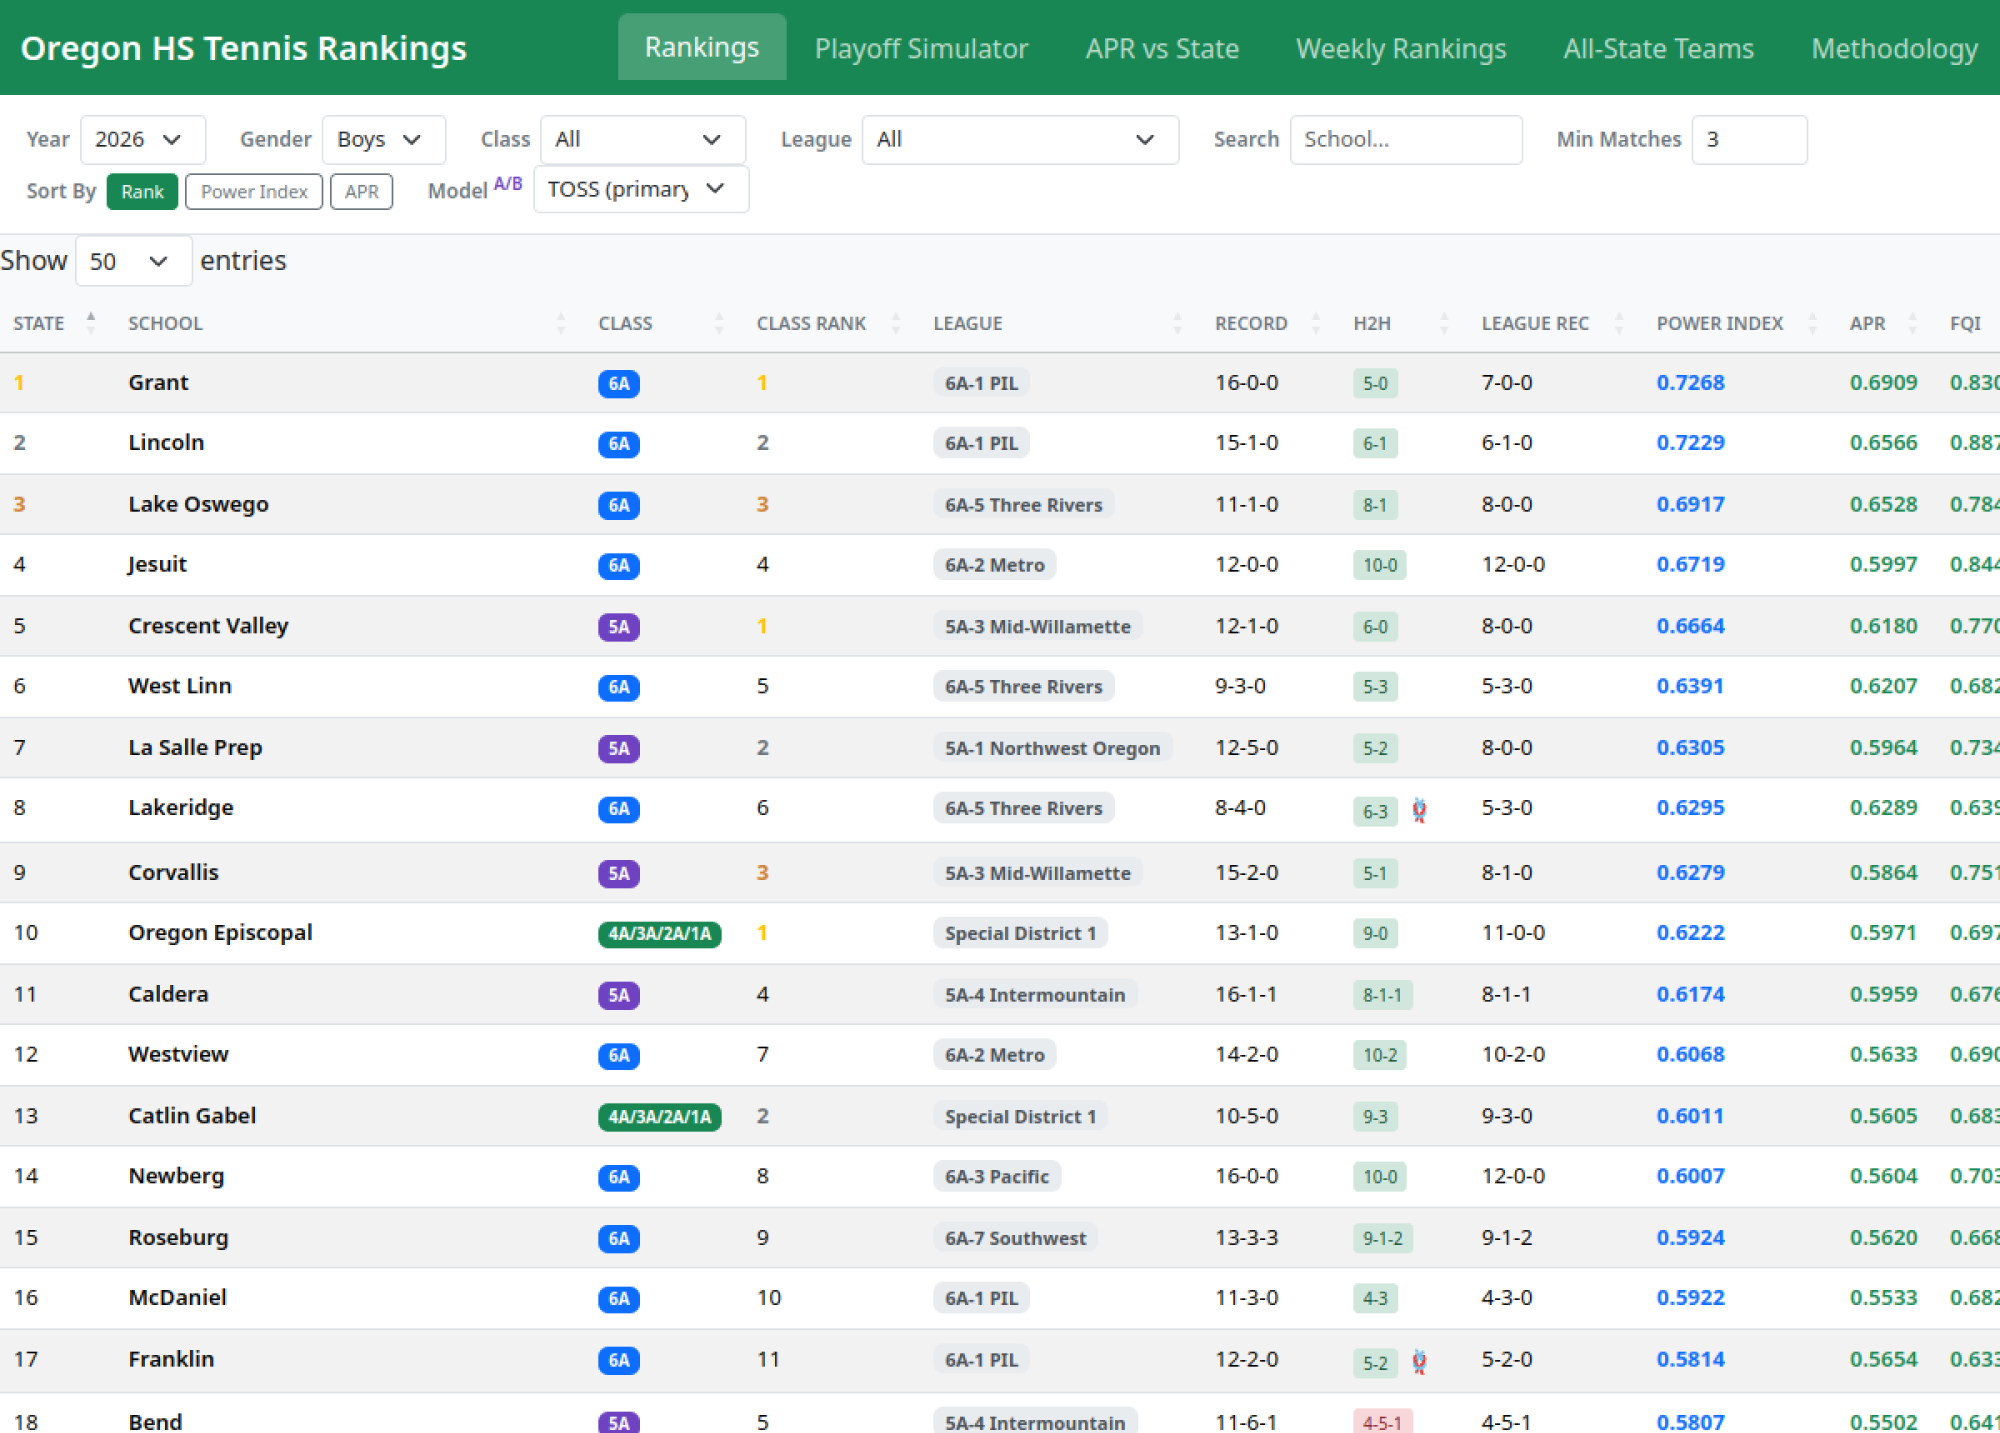
Four years of statewide results, four rating models I designed, a playoff simulator, and a set of live tournament tools, all generated from raw match data and served as one static site.
These are independent rankings I built for myself, like the computer rankings in college football and basketball, but for high school team tennis.
I worked on this in the open. Back in an April 2025 writeup I shared an early version of the formula and the thinking behind it, the proof of concept that the live system grew out of.
The problem it models
A tennis dual meet is eight concurrent matches, four singles and four doubles, and the team that wins five flights wins the meet. That structure breaks ordinary ranking. A 5-3 win at the bottom of the lineup looks identical to a 5-3 win at the top, win-loss records skip over who you played, and lineups can be “stacked” to game any naive metric.
Existing ratings handled none of this. I had to define the measurement before building the rating models, simulation, and the public tools on top of it. It also has to absorb forfeits, ties, six-flight meets, classification changes, and messy results.
The models
APR: Adjusted Power Rating
RPI-style strength of schedule: your wins matter, your opponents’ more, theirs too. “How good are you, given who you played?”
FWS: Flight-Weighted Score
Scores all eight flights on a weighted curve (1st singles / doubles = 1.00 down to 4th doubles = 0.10, max 3.95). The top of the lineup drives the number, but depth still counts: a 7-1 sweep outscores a 5-3 win with the same top flights, which makes stacking pointless. Normalized for flights actually contested, so a six-flight meet still produces a clean number.
FWS+
FWS made legible, indexed like baseball’s ERA+. 100 is exactly average for the classification; 115 is 15% above. It recalibrates as the season fills in, so a team’s standing reads in real time and across history.
Power Index
The blend: (APR × 0.50) + (FWS × 0.50). It combines opponent quality and flight dominance in one number.
TOSS
A later model folding in game-share margin. A/B-tested against the Power Index with results reported.
H2H engine
When teams are close, head-to-head breaks the tie, but only when it avoids a rock-paper-scissors loop (A beats B beats C beats A). Split series defer to the metrics.
On the site
The site grew from an All-State archive into a public suite of tools.
- Rankings dashboard. Every team rated by all four models, filterable by year, classification, and league.
- Playoff simulator. What-if brackets, with a regional mode that optimizes travel against competitive integrity.
- Comparison view. Head-to-head and model-vs-model, plus rating-vs-actual results, showing how well dual-meet strength predicts the individual tournament.
- Methodology. The Power Index explained in plain language, so the rankings are auditable.
- Weekly in-season rankings. Snapshots, week by week, live.
- All-State archive. Teams from 2022 to 2025 in one place.
- Bracket tools. A permutation explorer and a fair-bracket generator that stress-test how different seedings actually play out.
- SD1 draw suite. A live seeding board, draw tool, and printable / live brackets built to run an actual special-district tournament in the room, on the day, with cloud-saved state.
- 2027 format tools. A mixed-doubles standby-list tool and a dual team finals format.
- Changelog and after-action reports. What changed, what was tested, what was learned.
Stack & method
- Generation
- A single Python program computes every model and emits one self-contained
index.htmlwith the data embedded. - Geocoding
- Nominatim / OpenStreetMap, geocoded once and cached so fresh clones skip the network. Powers the simulator’s travel optimization.
- Frontend
- Vanilla JS + Bootstrap + DataTables over embedded JSON. React / TypeScript / Vite in the original prototype.
- Live tooling
- Netlify Functions (v2) + Netlify Blobs for the cloud-saved SD1 draw.
- Hosting
- Netlify. Static, zero-infrastructure, offline-capable.
Design decisions
Static HTML with embedded JSON serves coaches and athletic directors, who need something fast, free, and saveable. A dataset this size belongs in the page. The model exposes raw, intuitive scores (0 to 3.95 FWS, ERA+-style FWS+) up front and keeps the normalized math underneath.
The design work went into the model: a rating design that makes stacking pointless, tiebreaker logic that refuses circular results, travel optimization that protects top seeds while cutting miles for the rest, and a methodology published in full so the numbers carry their own evidence.